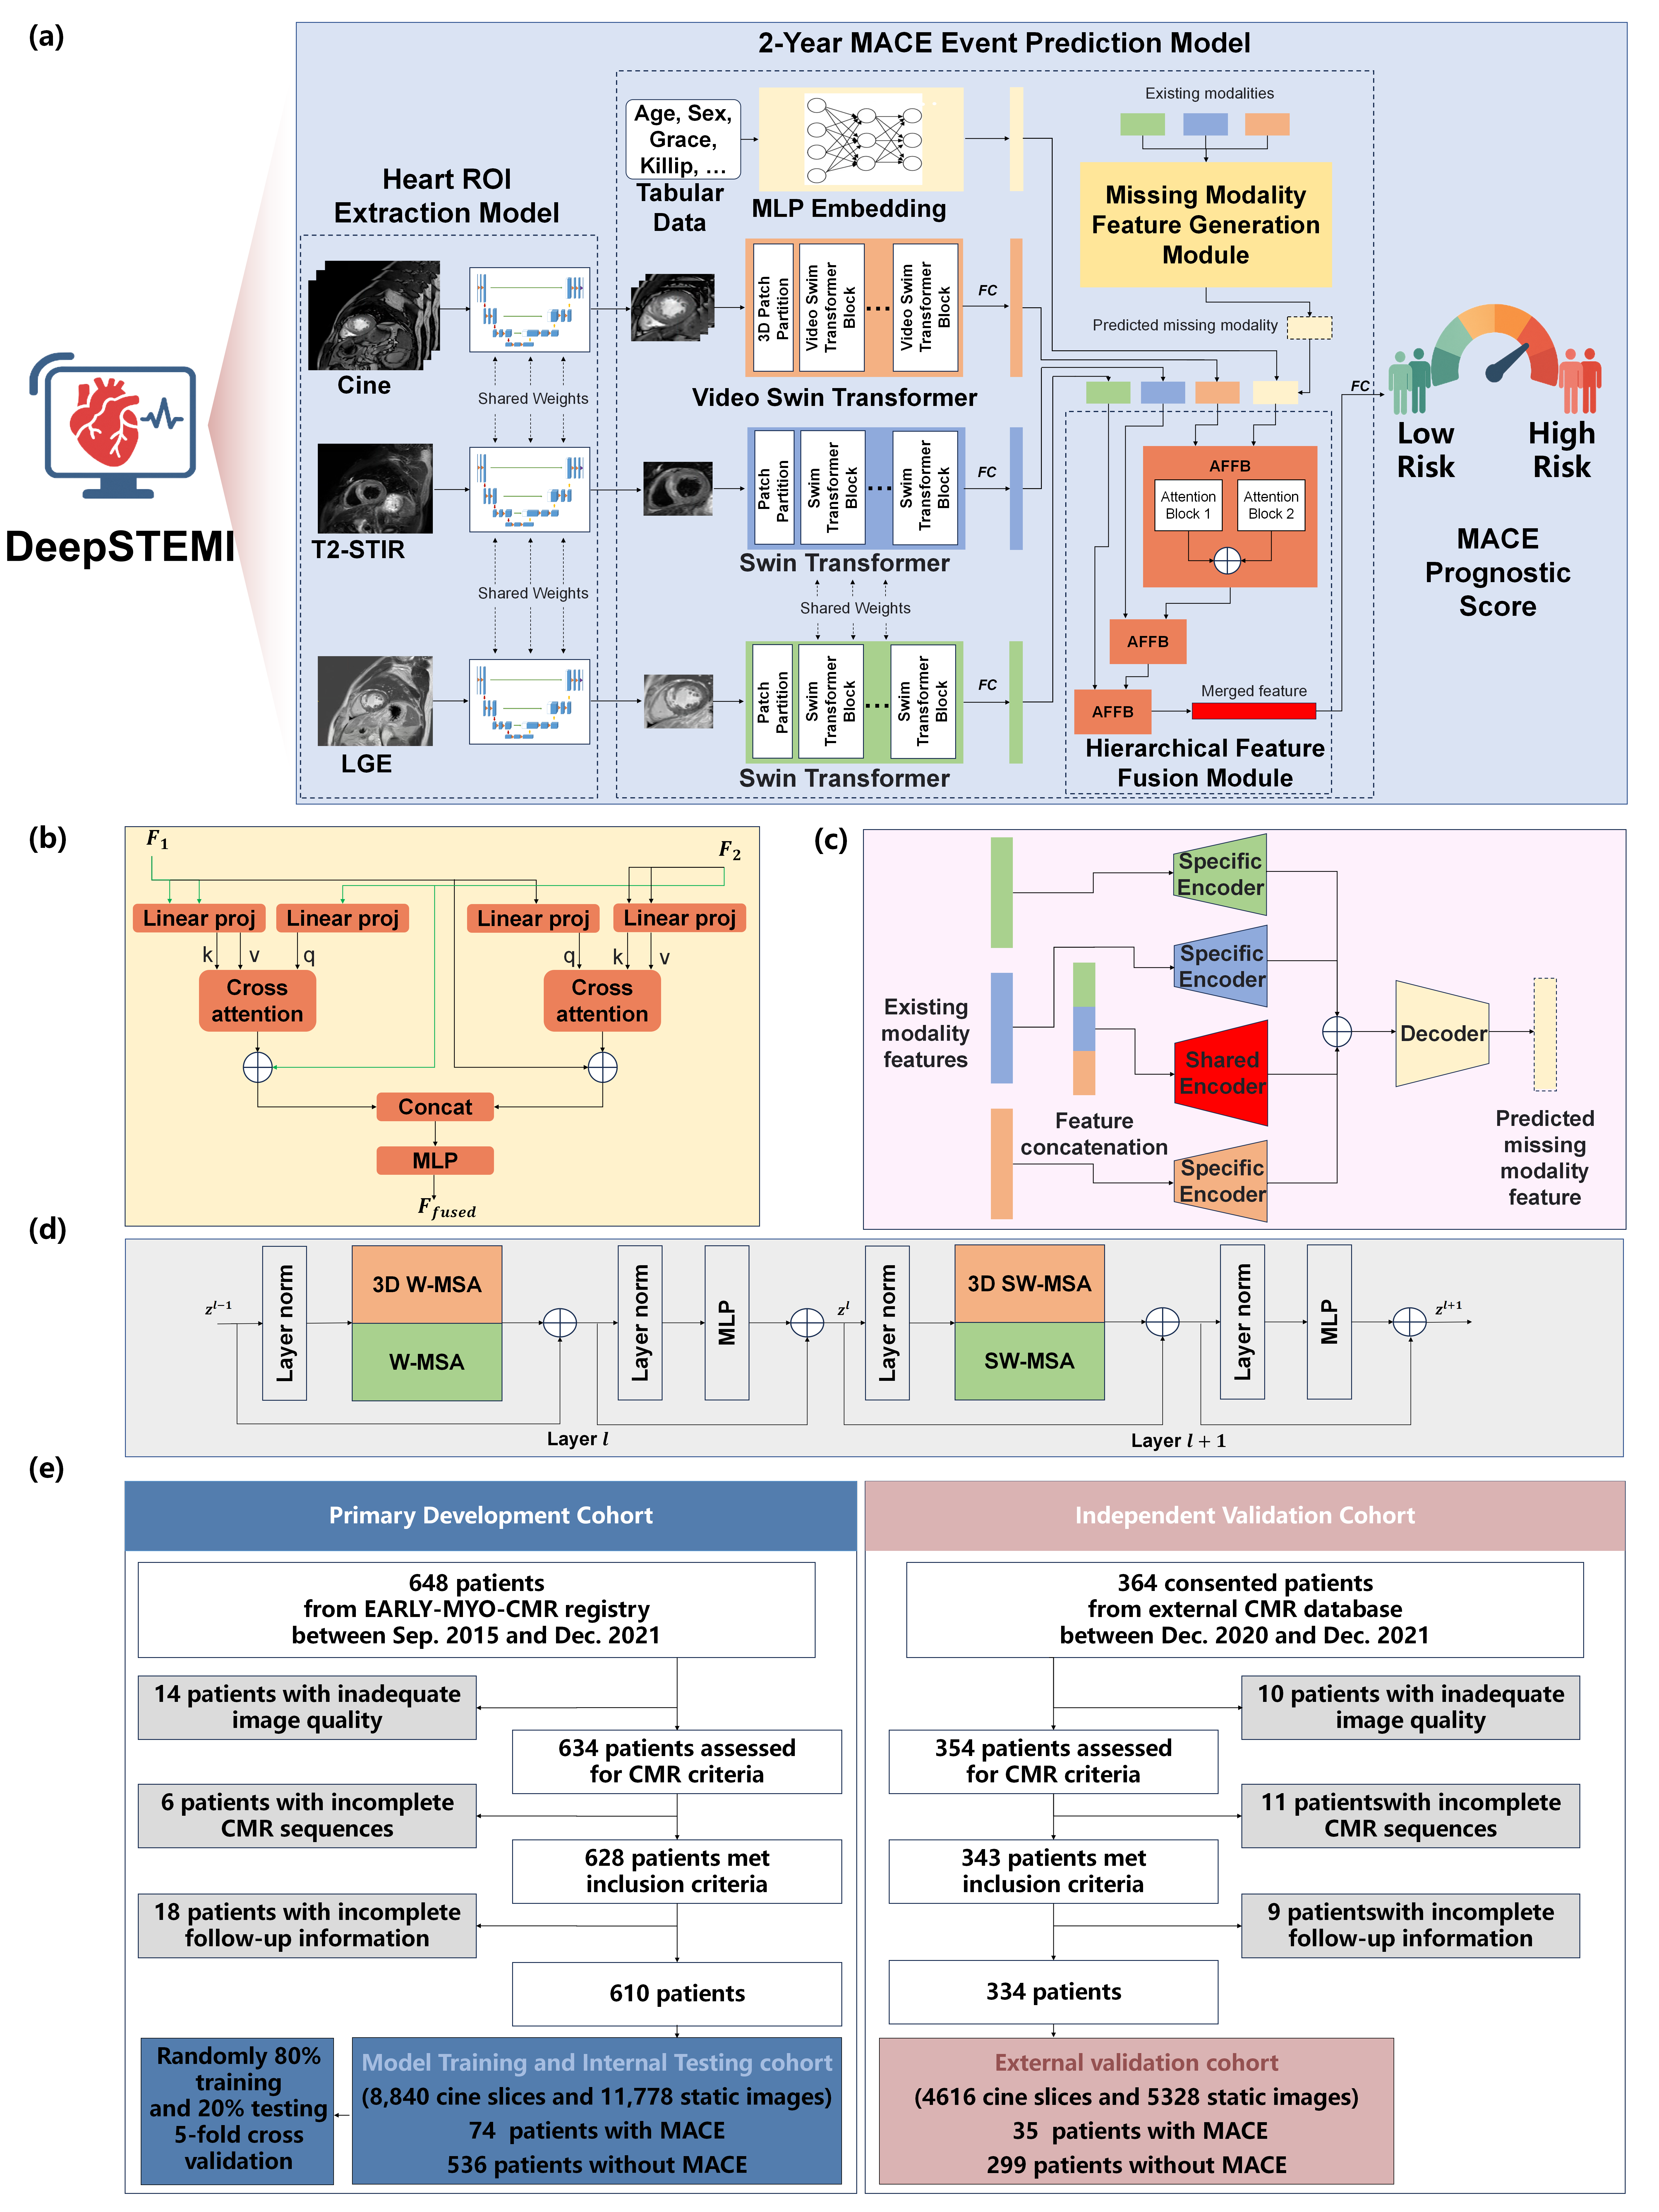
a, The proposed DeepSTEMI framework integrates multi-sequence cardiac magnetic resonance (CMR) imaging including cine steady-state free precession (cine SSFP), T2-weighted short tau inversion recovery (T2-STIR), and late gadolinium enhancement (LGE), with tabular clinical variables (age, sex, GRACE score, Killip score) for predicting 2-year major adverse cardiovascular events (MACE). A U-Net-based model extracts heart regions from raw CMR inputs. Video Swin Transformer processes cine images, while static LGE and T2-STIR images are analyzed using Swin Transformer. Clinical data are embedded via a multi-layer perceptron (MLP), and features from all modalities are fused for final risk prediction.
b, Detailed structure of Attention-based Feature Fusion Block (AFFB). AFFB integrates two input features via attention mechanism and output the fused feature with the same dimension.
c, Detailed structure of Missing Modality Feature Generation Module (M2FGM). M2FGM allow the model to handle scenarios of missing modalities, enabling predictions with incomplete inputs.
d, Illustration of two consecutive transformer blocks in the deep learning framework, composed of multi-head self-attention modules with either window-based (W-MSA) or shifted window (SW-MSA) configurations, layer normalization, and feedforward multilayer perceptrons.
e, Patient recruitment flowchart. The development cohort included 610 patients (8,840 cine slices and 11,778 static images) from the EARLY-MYO-CMR registry. External testing comprised 334 patients (4,616 cine slices and 5,328 static images) from three independent cardiac centers after exclusion of cases with inadequate image quality or incomplete data.
Abbreviations: CMR, cardiac magnetic resonance; LGE, late gadolinium enhancement; T2-STIR, T2-weighted short tau inversion recovery; MLP, multi-layer perceptron; MACE, major adverse cardiovascular events.
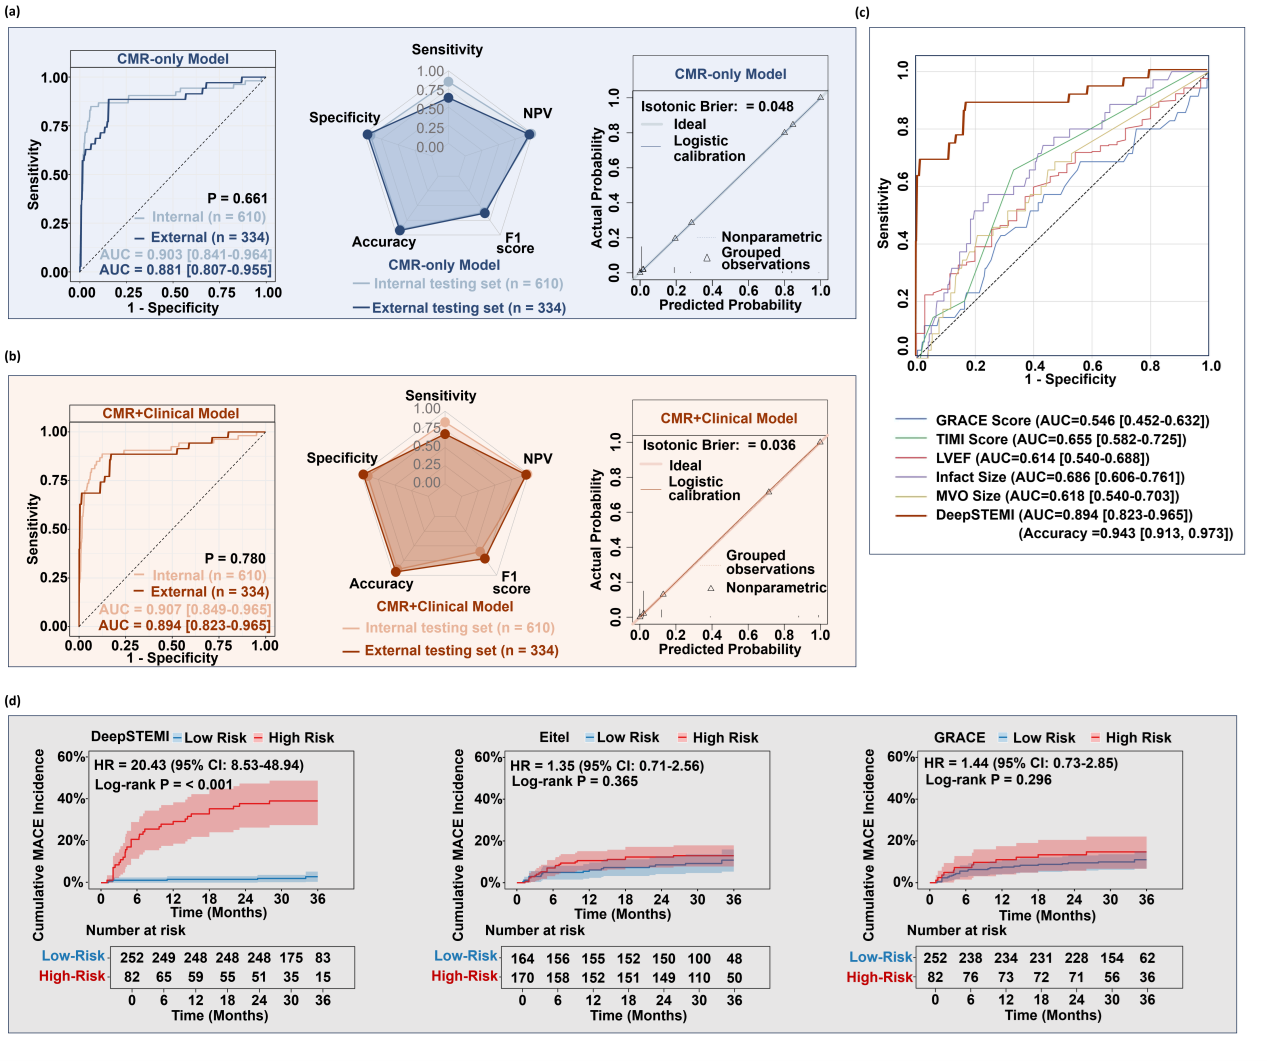
a, ROC curves, classification radar plots, and calibration plots for the DeepSTEMI model trained on imaging-only (CMR-only) inputs in internal and external testing cohorts.
b, ROC curves, classification radar plots, and calibration plots for the DeepSTEMI model integrating both CMR and clinical variables (CMR+Clinical model).
c, Comparative ROC analysis in the external cohort between DeepSTEMI and conventional risk markers, including clinical scores (GRACE, TIMI) and manually-derived CMR metrics (LVEF, infarct size, MVO size).
d, Kaplan-Meier curves for cumulative MACE incidence stratified by DeepSTEMI, Eitel CMR risk score, and GRACE score in the external testing cohort. DeepSTEMI achieved the strongest risk separation with a 23.24-fold hazard increase in high-risk patients (P < 0.001), while Eitel and GRACE scores did not reach statistical significance.
Abbreviations: AUC, area under the curve; CMR, cardiac magnetic resonance; HR, hazard ratio; LVEF, left ventricular ejection fraction; MVO, microvascular obstruction; MACE, major adverse cardiovascular events; NPV, negative predictive value; ROC, receiver operating characteristic.
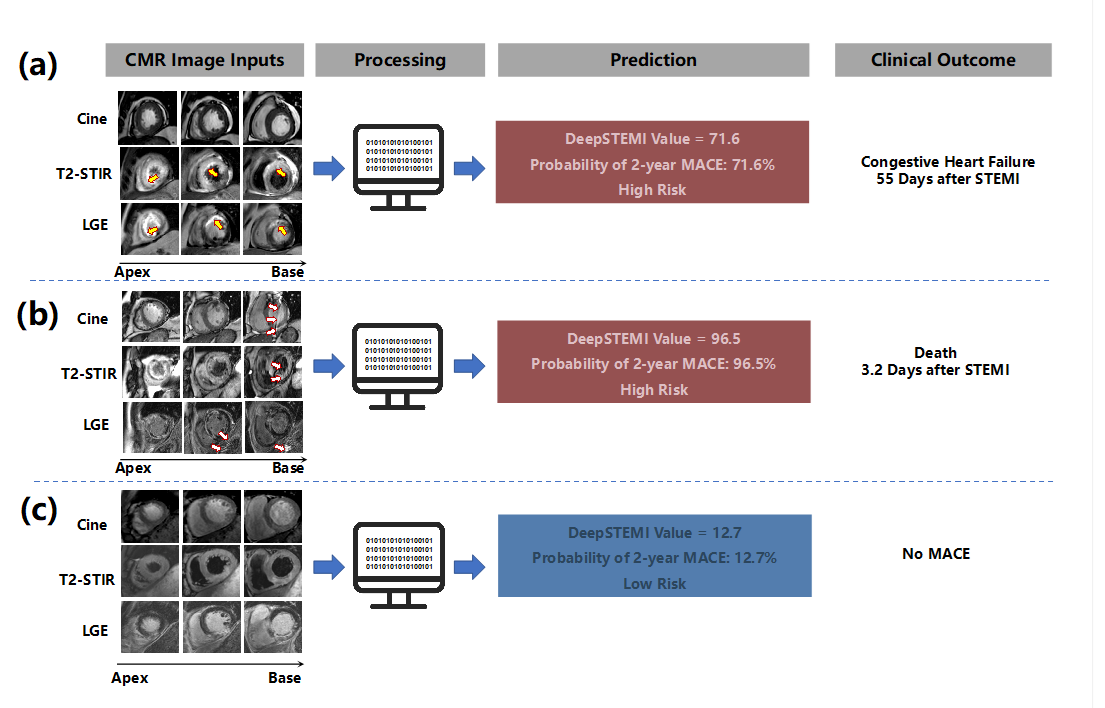
a, A representative high-risk patient correctly identified by DeepSTEMI. CMR images show reduced left ventricular systolic function, myocardial edema on T2-STIR, and extensive late gadolinium enhancement (LGE) in the anterior wall (arrows). The patient experienced congestive heart failure 55 days after STEMI.
b, A high-risk case with motion and imaging artifacts (arrows) present in all three CMR sequences. Despite suboptimal image quality, DeepSTEMI correctly predicted a high probability of MACE, which occurred as early death 3.2 days after STEMI.
c, A low-risk patient with preserved ventricular function, limited edema, and no significant LGE. DeepSTEMI predicted a low probability of MACE, which was consistent with an event-free follow-up.
Abbreviations: CMR, cardiac magnetic resonance; LGE, late gadolinium enhancement; T2-STIR, T2-weighted short tau inversion recovery; MACE, major adverse cardiovascular events.
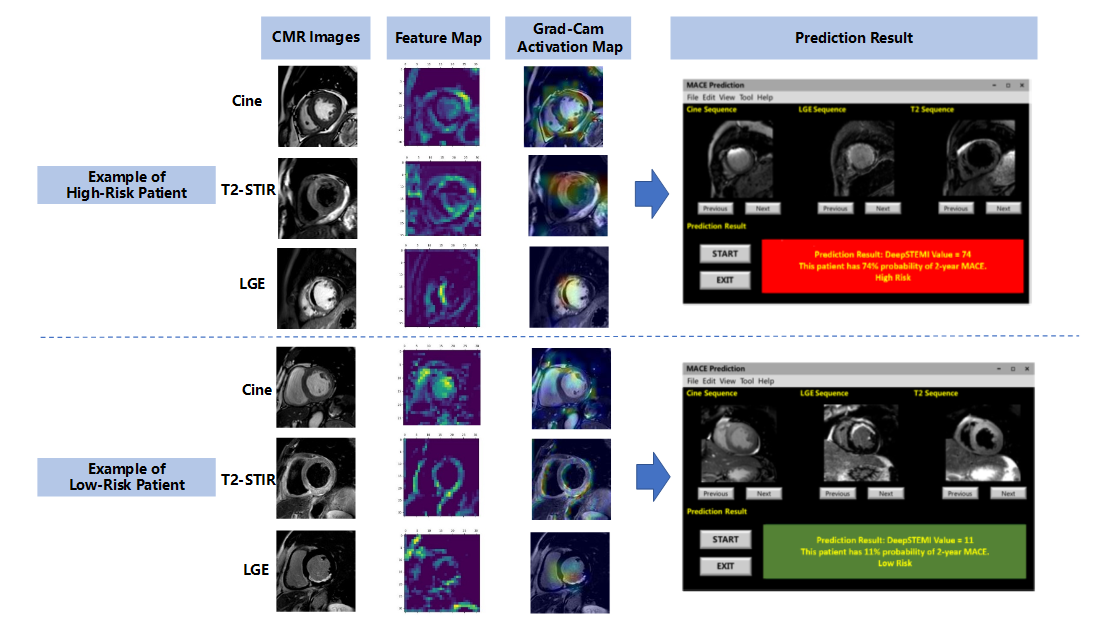
The upper and lower panels illustrate representative examples of patients classified as high-risk and low-risk for 2-year MACE, respectively, as predicted by the DeepSTEMI model. For each case, original CMR images (cine, T2-STIR, and LGE), intermediate feature maps, and Grad-CAM activation maps are shown. In high-risk patients, Grad-CAM highlighted motion-related regions within the myocardium and blood pool in cine sequences, as well as infarct-related areas in T2-STIR and LGE sequences, suggesting that the model integrates dynamic and tissue-based features for prognostic inference. In low-risk cases, activation was minimal or spatially diffuse, reflecting the absence of overt myocardial injury. The right column shows the prototype software interface developed to facilitate clinical deployment of DeepSTEMI. The system displays CMR images alongside the final model output—expressed as a score between 0 and 100—indicating the predicted probability of experiencing a MACE within 2 years. Patients are automatically categorized as high- or low-risk based on a predefined decision threshold. The interface supports image browsing across sequences and time points, offering clinicians an interpretable and interactive prediction environment.
Abbreviations: CMR, cardiac magnetic resonance; LGE, late gadolinium enhancement; T2-STIR, T2-weighted short tau inversion recovery; MACE, major adverse cardiovascular events.Grad-CAMions: CMR, cardiac magnetic resonance; LGE, late gadolinium enhancement; Tn system.
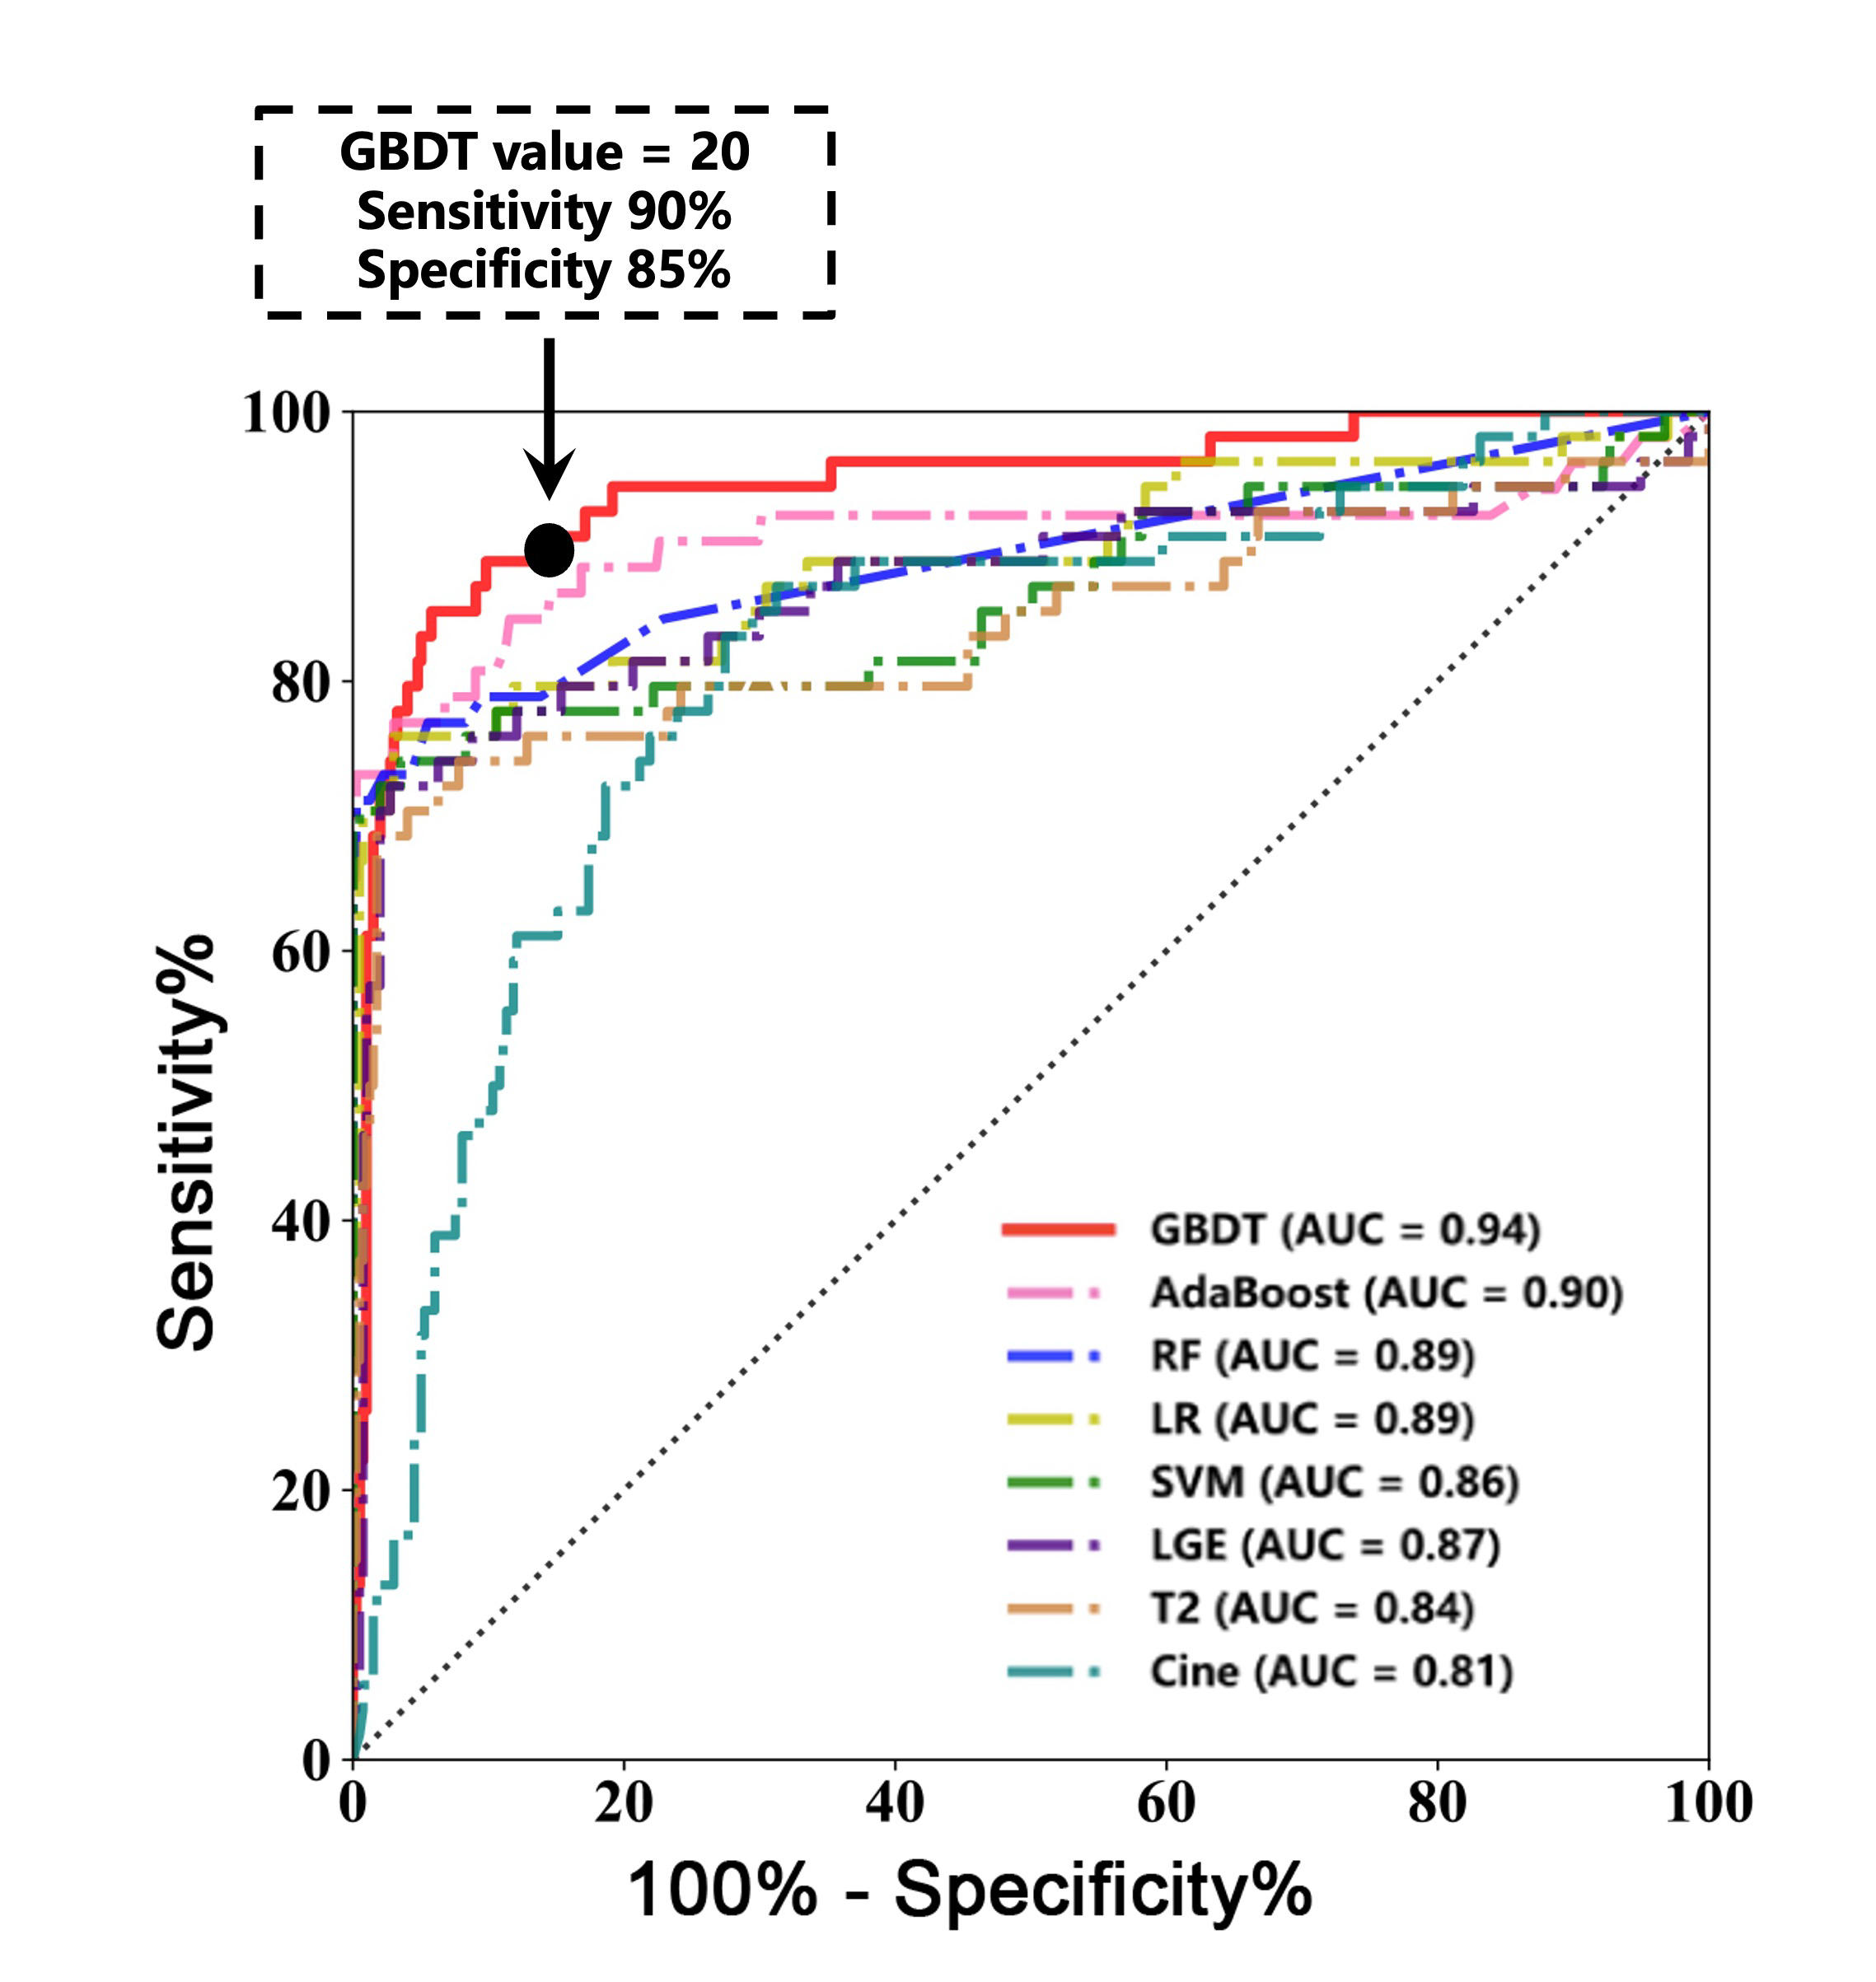
All five final classification prediction models achieved higher AUC values for predicting 2-year MACE compared to the pre-prediction model within the training set. Among these models, the GBDT-based prediction model demonstrated the highest AUC of 0.94 (95% CI, 0.91–0.98, P<0.001), and was selected as the optimal final classification model for the subsequent analyses. Using a GBDT cutoff value of 20 on the receiver operating characteristic curve, patients at risk of 2-year MACE could be identified with 90% sensitivity and 85% specificity.
AUC = area under the curve; GBDT = gradient boosting decision tree; LR = logistic regression; MACE = major adverse cardiovascular events; RF = random forest; ROC = receiver operating characteristic; SVM = support vector machine.
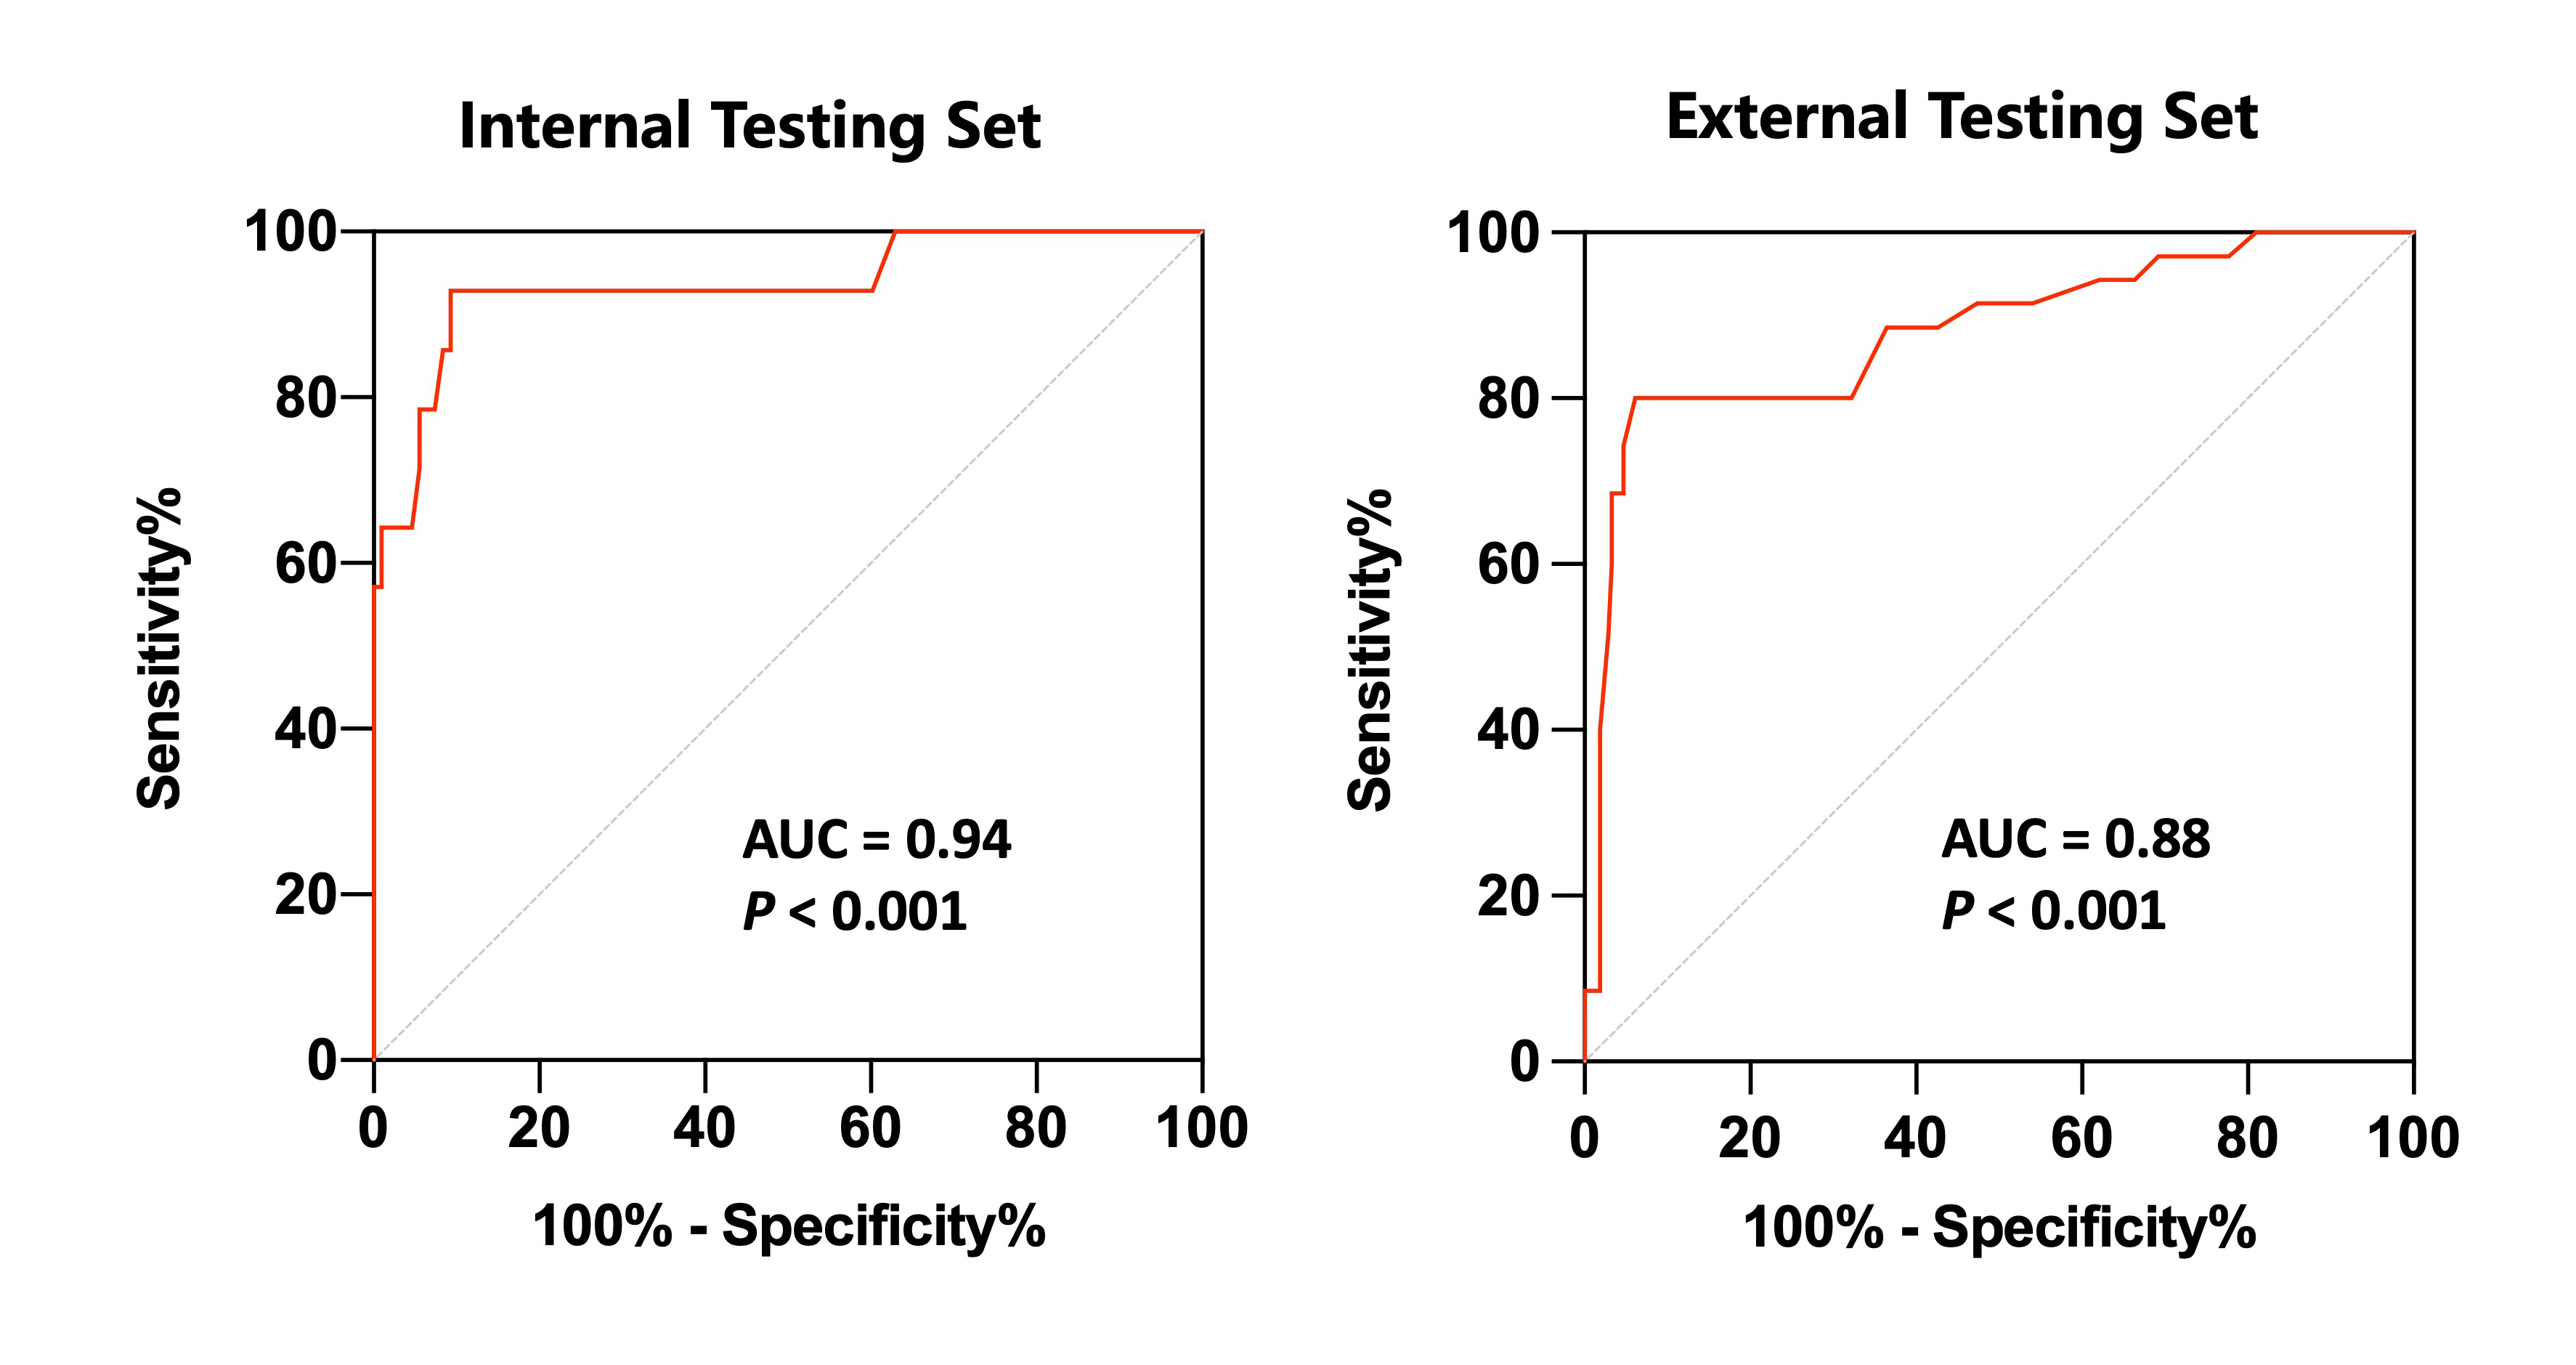
The receiver operating characteristic curve demonstrated that the AUCs of the GBDT-based prediction model for predicting 2-year MACE were 0.94 and 0.88 in the internal and external testing sets, respectively (both P < 0.001).
AUC = area under the curve; GBDT = gradient boosting decision tree; MACE = major adverse cardiovascular events.
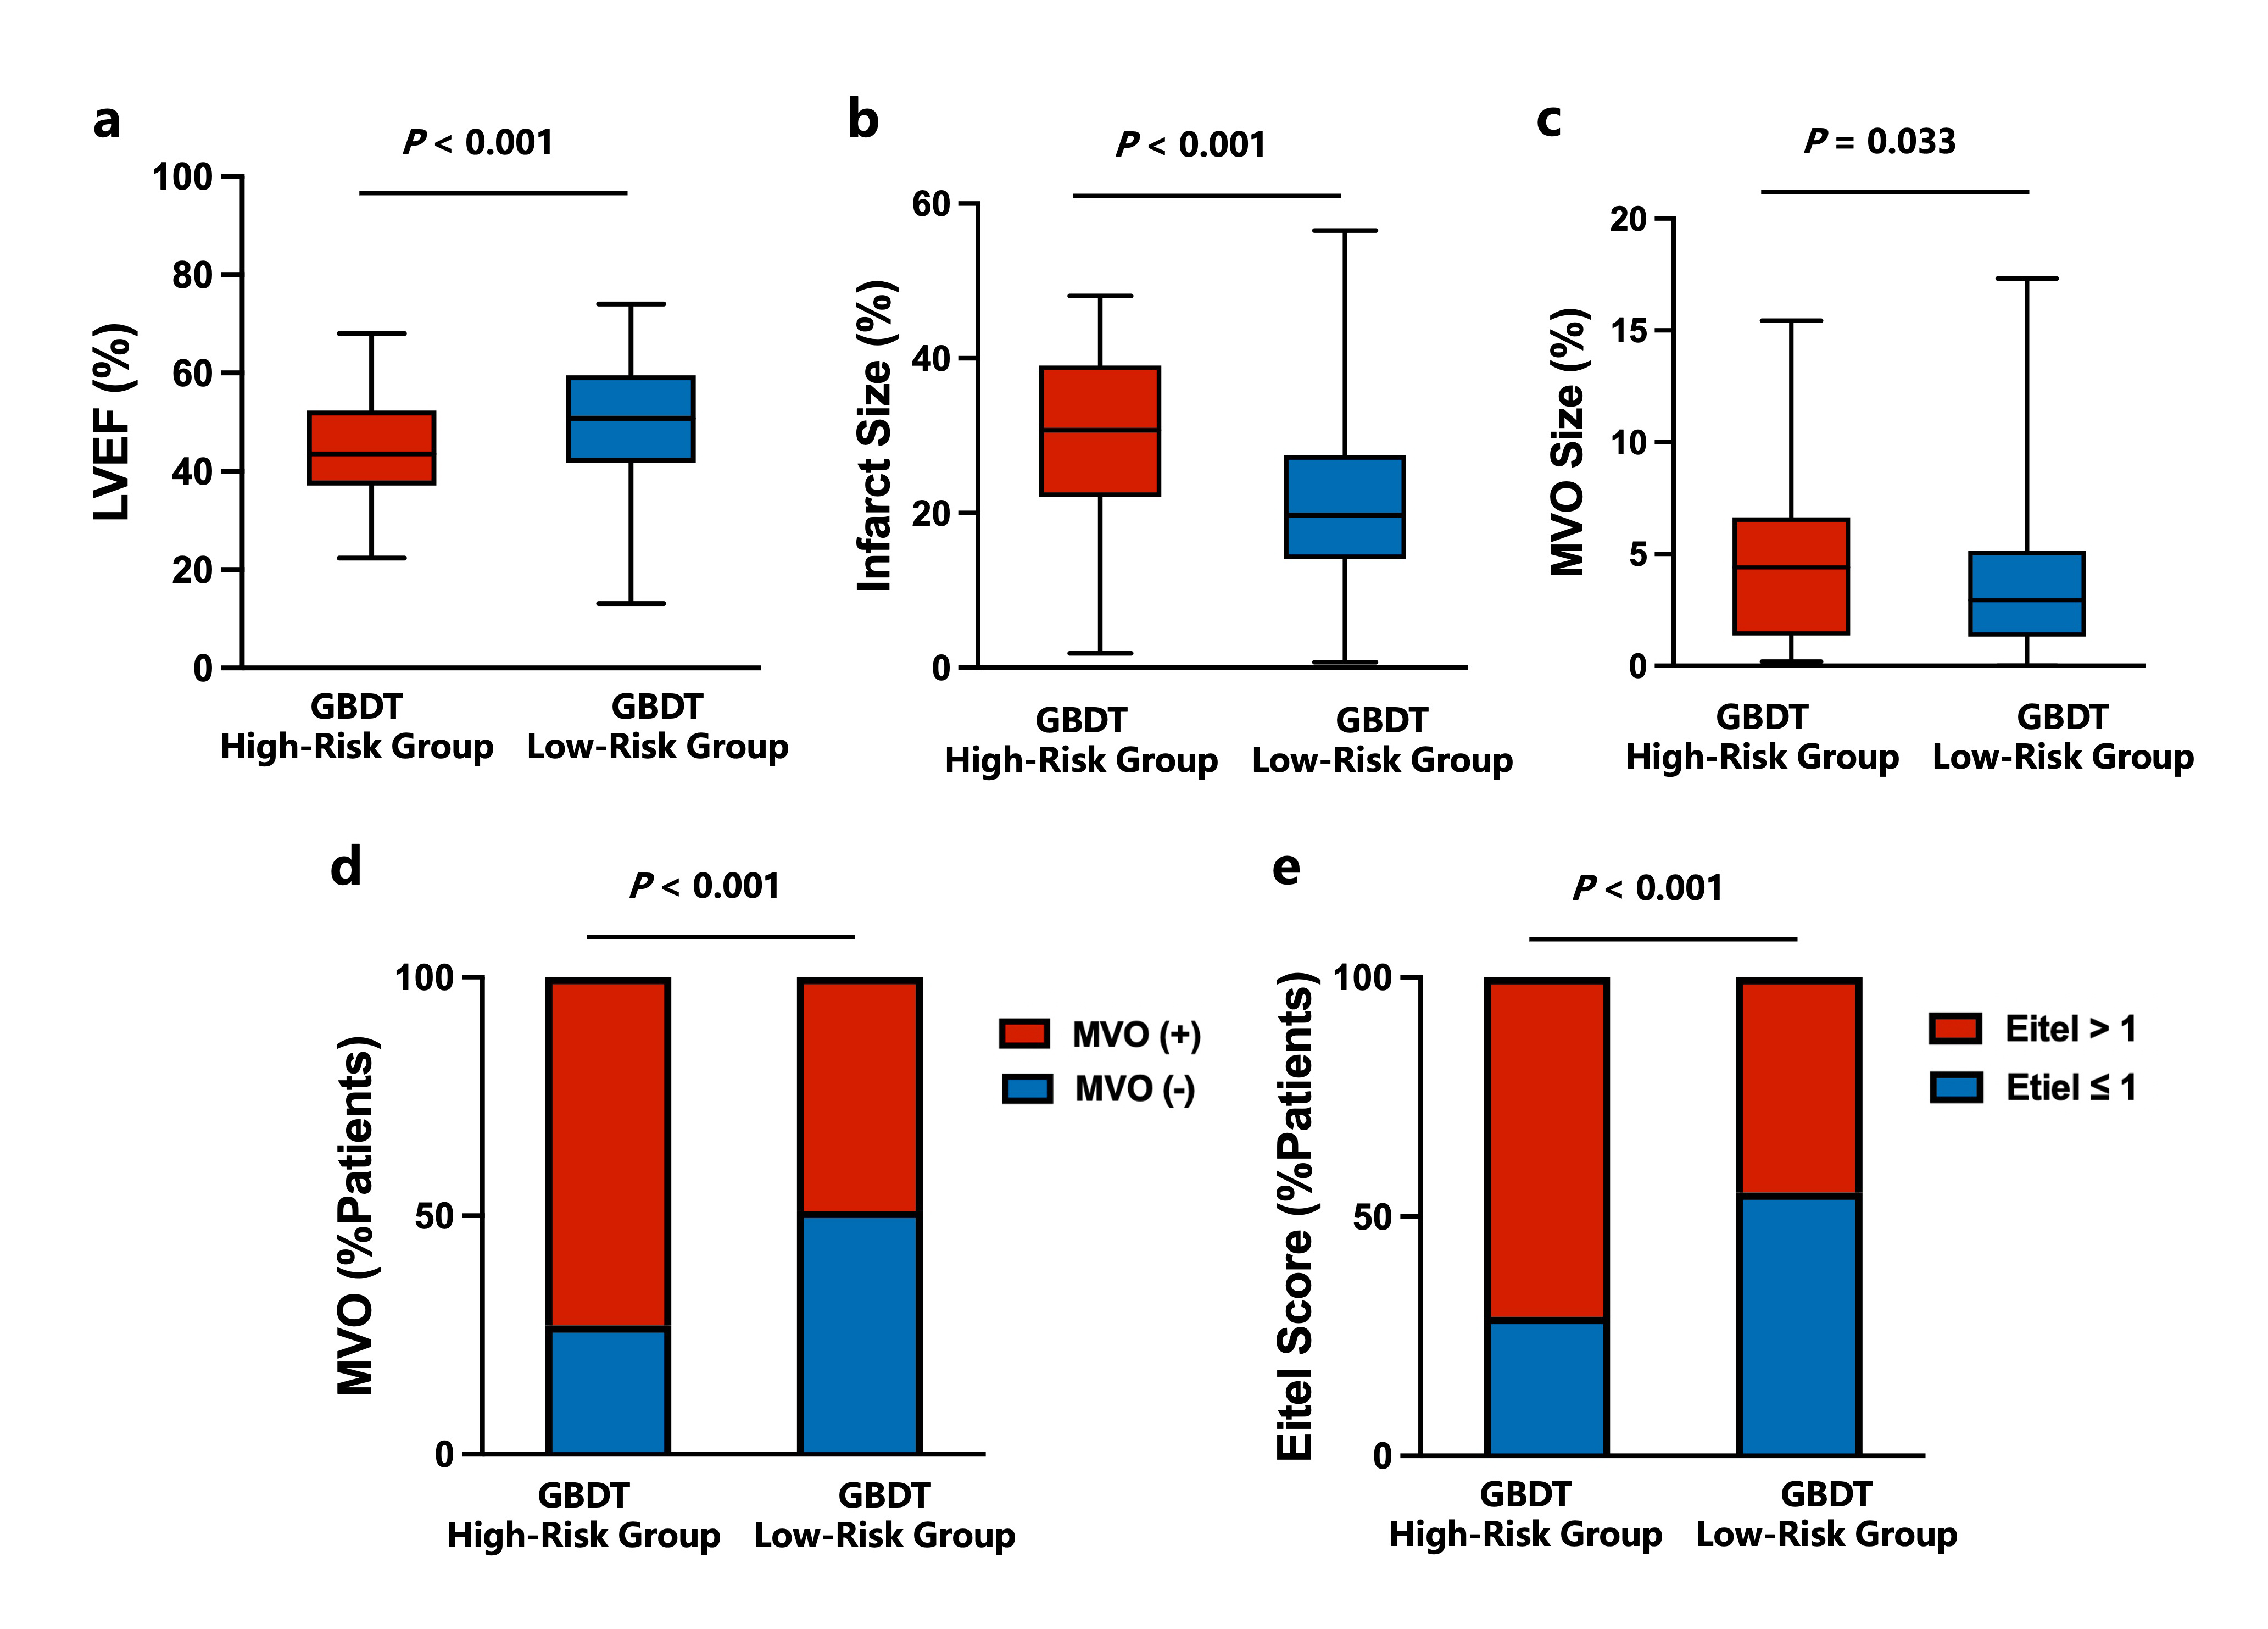
(a-b) Box-and-whisker plots (box: 25th percentile, median, and 75th percentile; whisker: the minimum and maximum) of LVEF, infarct size and MVO size.
(c) Percentage of patients with and without MVO.
(d) Percentage of patients with Eitel scores>1and ≤1 in the high and low-risk groups.
CMR=cardiac magnetic resonance; LVEF=left ventricular ejection fraction; MVO=microvascular obstruction.